NBA GAME PREDICTOR
Python
Project
Overview
In this passion project I scraped data from basketball-reference.com in order to train a model to predict the results of various NBA games. This project required lots of data cleaning and preparing, showcasing my ability to work with messy data and my proficiency with the python language. This was the first model I've ever created. I will walk you through my process of creating it.
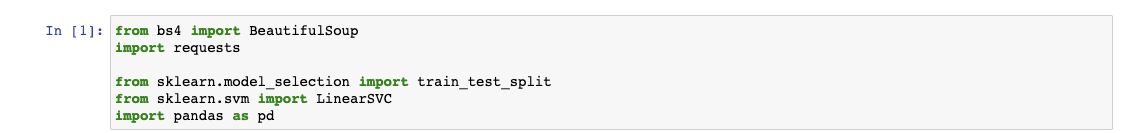
First, let's start by importing the required libraries.
Next, I will just initialize some contants that will be helpful for later on in the process. The year will be plugged into the url so that the url can be dynamic, and then the total_stats and dates varibles will be empty lists that we will be adding data into once we make our requests.

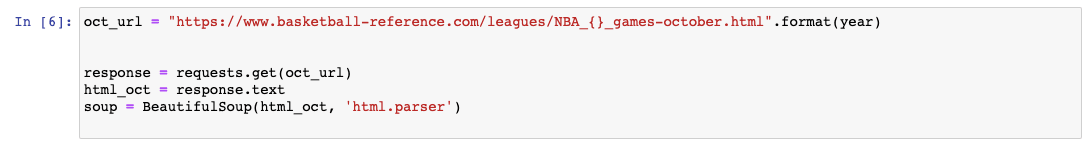
Next, I want to initalize the first url that we will be scraping. I am going to use data from the 2022-2023 season from October to December. However, it will be set up so that I can add more months to this process in the future if I want to.
Also, here we will initalize our response and soup variables. At this moment, if we were to print the soup variable, we will get back the entire html code for the webpage, so we are right on track.
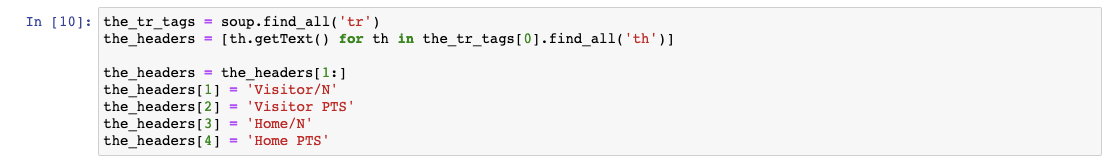
Now, Let's grab the headers from the table. I am using soup.find_all('tr') in order to get all tr tags and then I loop through those in order to get the th tags which is where the headers are going to be. Then we assign that list to a variable called the_headers. I will rename some for consitency.
Okay, now we will start getting a little more messy. First we will use some advanced list comprehension methods in order to get the dates of each game.
The code is iterating over each table row (tr tag) in the_tr_tags and finding all the links (a tags) within each row. It then collects the text content of each link and stores it in a nested list called date, with each inner list representing the links found within a specific table row.
Next, the code is looping through all the tr tags once again but is skipping the 0 index which contains the headers. This is an attempt to get all of the necessary data that is stored in td tags. This block of code does pretty much the same thing as above, but gets the data and stores that in a variable called oct_results.
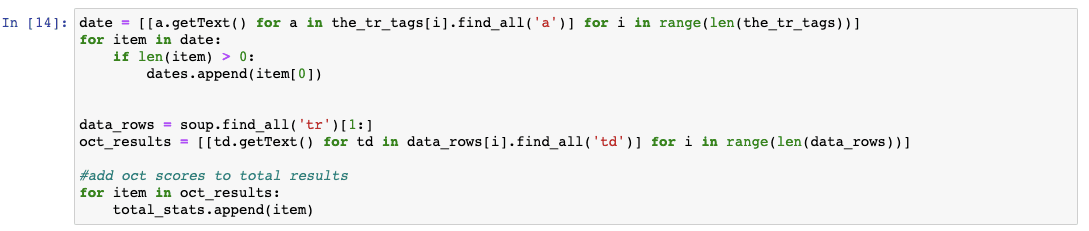
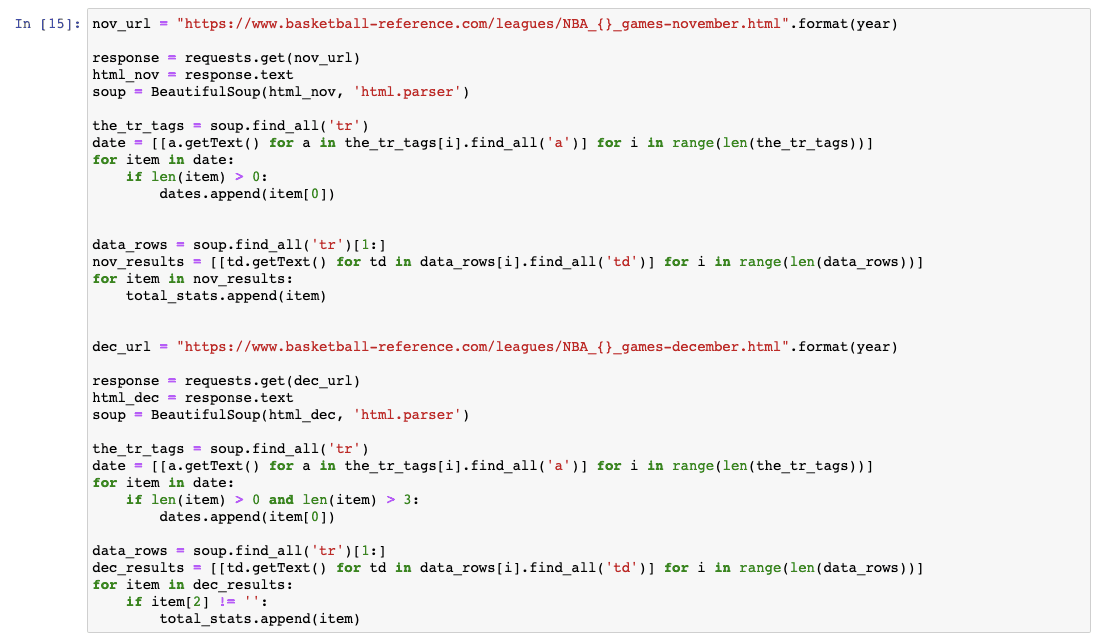
I am now going to repeat this process for both November and December. Both times I am going to append that months stats to the total_stats variable.
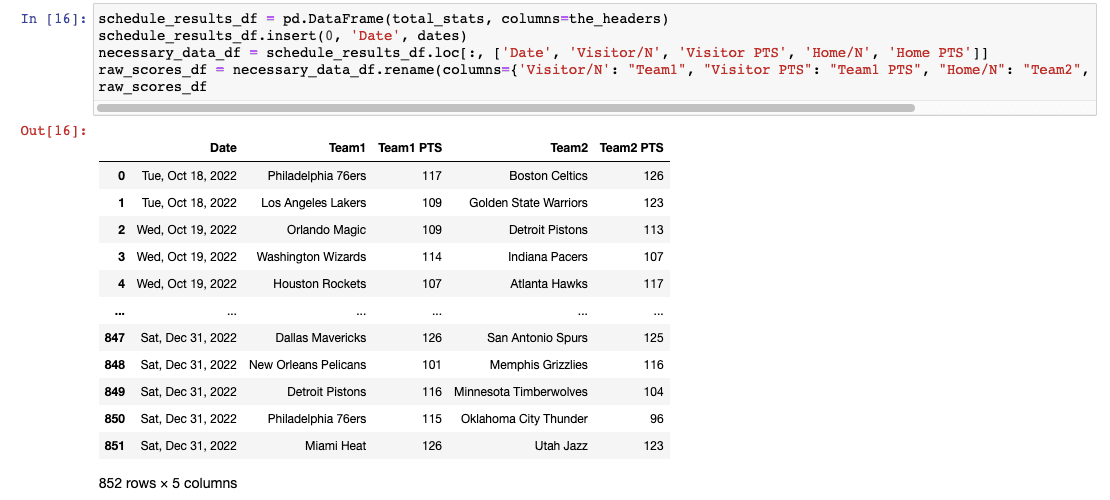
Now I have pretty much everything I need to create the first df that will contain the raw scores. I will assign the columns to be the the_headers variable I created earlier and also add the date variable at the start of the df. Additionally, I really only need the headers to be 'Date', 'Visitor/N', 'Visitor PTS', 'Home/N', and 'Home PTS' so I will restrict the df to only show that data. Then lastly, I will rename the column headers to clean it up a bit. This is exactly what it should look like.
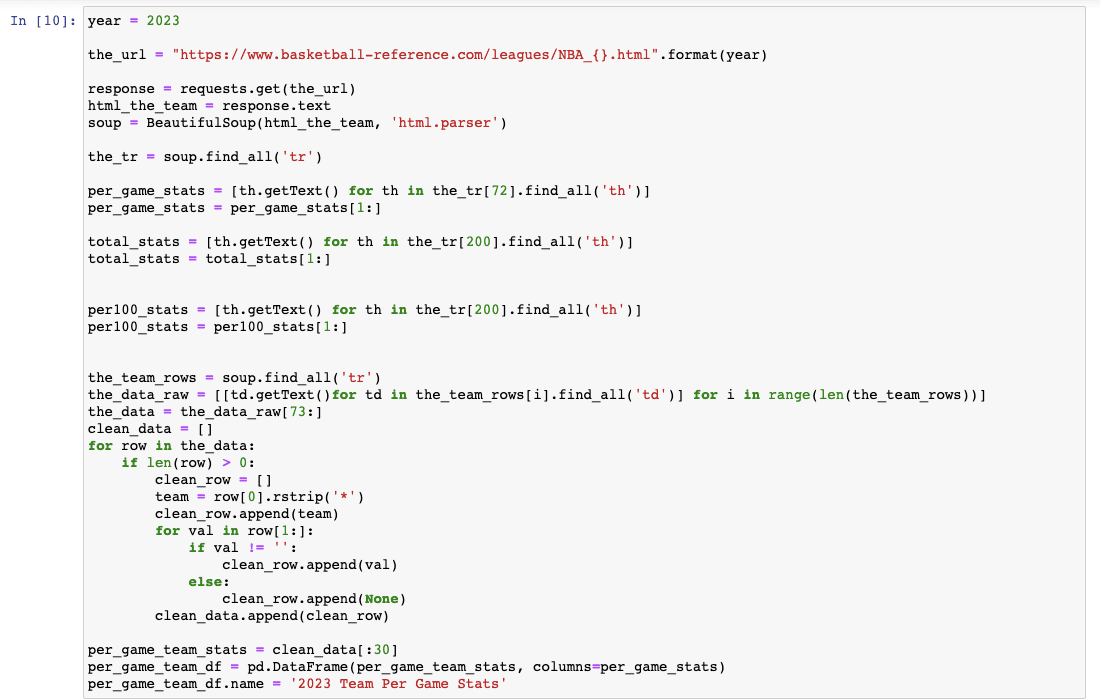
Next, I need to get the team stats per game in order to make the model more accurate. These stats will include things like fg%, ft%, 3pt%, ast, stl, and a whole lot more. For this, we need to use a new url so we will reininitalize our response variable as well as our soup variable. I will then look through all the tr tags and grab the th tags that are in the 72nd index because that index contains the table that we want. We dont want the headers so we will skip the 0 index by saying total_stats = total_stats[1:]. I will do the same process for both the total stats and per 100 game stats which are tables on the same url web page. I may or may not use these two varibles later on.
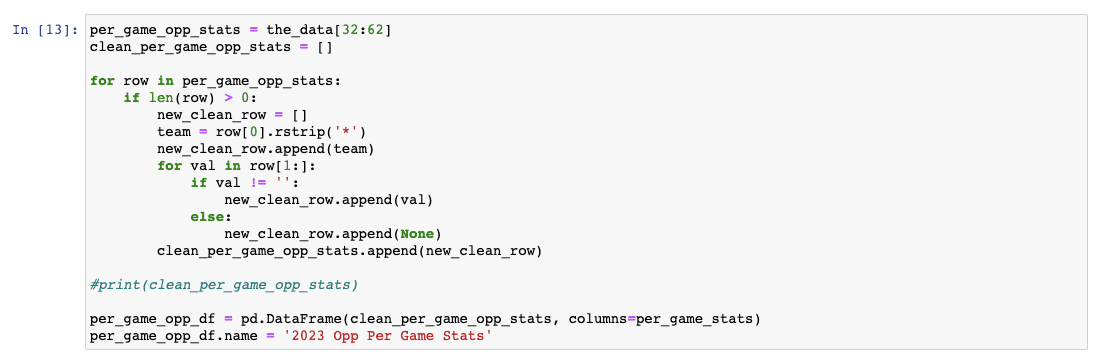
Next, I need to get the name of each team and put that at the 0 index of each list so that it looks the the_data variable looks something like this [[team, stat1, stat2, ...] [team, stat1, stat2,...]...]. After I did this, I realized that some of the team names had a random '*' at the end. So, I had to make a new varible called clean_data and loop through the list I just created and use rstrip to remove that '*' from the end and then append the new team list to the clean_data variable.
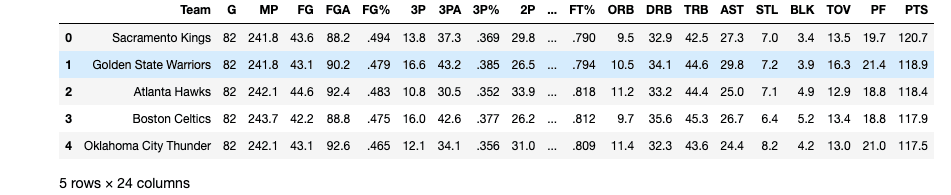
Now, I have what I need to create a 2023 team per game stats df.
Here is what that should look like:
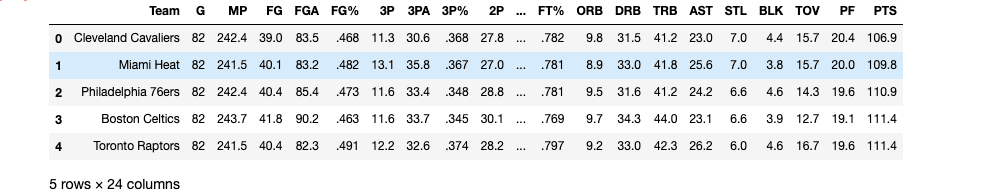
Next, I want to know what each teams opposing team stats are per game. Basically, I want to know how good or bad each team is defensively. Here, I will basicall do the same thing I just did to create an opposing teams stats df. I will have to clean the data just like above because I will still getting that random annoying '*' at the end of some team names.
Here is what that should look like:
Now, it is time to combine the previous two df's into one big df. This will easily show us all the relevant stats per team. This is what it should look like:
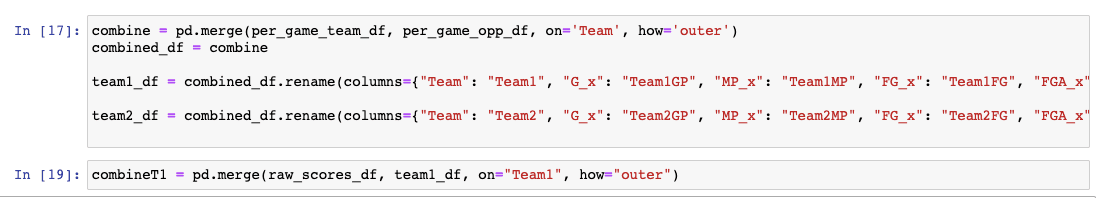
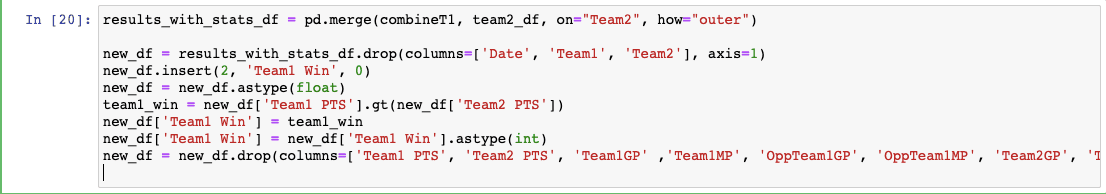
Finally, the last thing we need to do before predictions, is to combine the big df we just made with the game results df. This will give us the scores for each game as well as the teams that played and the stats going into each game for each team. Here is how I did that:
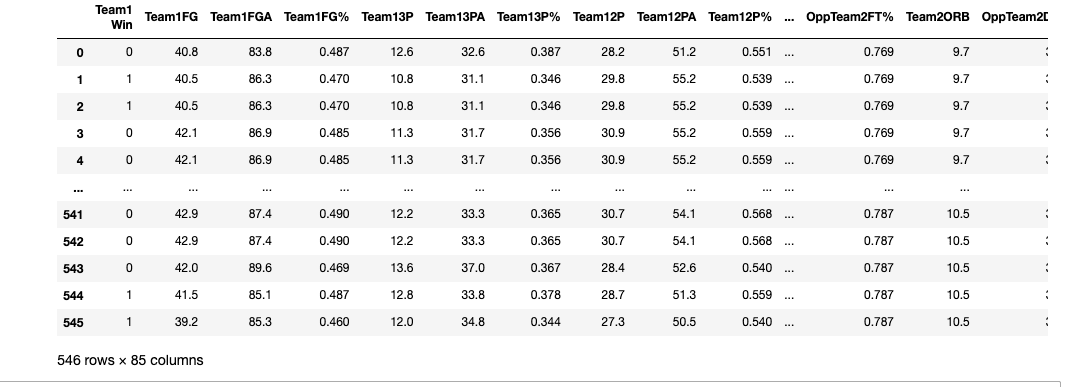
Here's what that df looks like:
Next, lets import what we need to conduct linear regression and see how well this model fits our data. Here, I will create the train and test variables that will be used with other models as well.
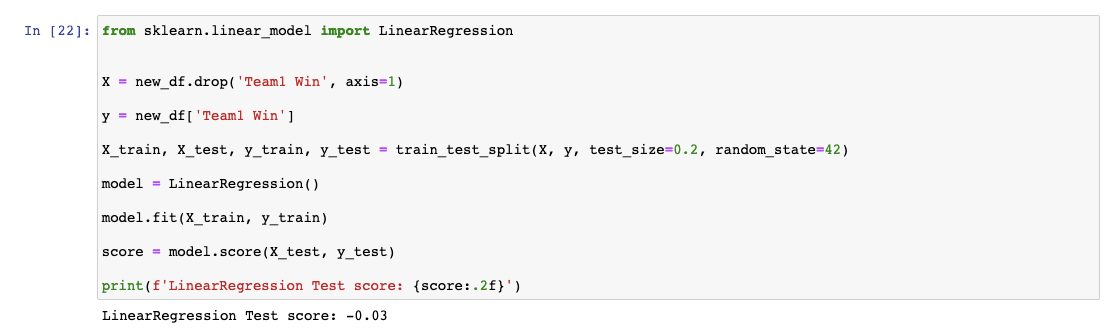
This gives us a really bad score so let's move onto a different model.
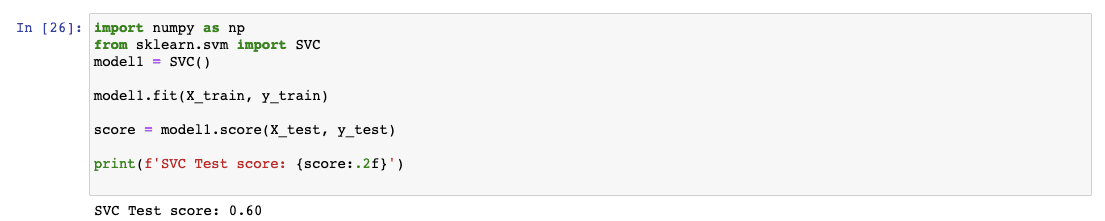
I will speed this us and just tell you that I found the SVC model to be the best. Here is how I found that out:
Although .60 isn't the best score, it is good enough for me to use for this analysis.
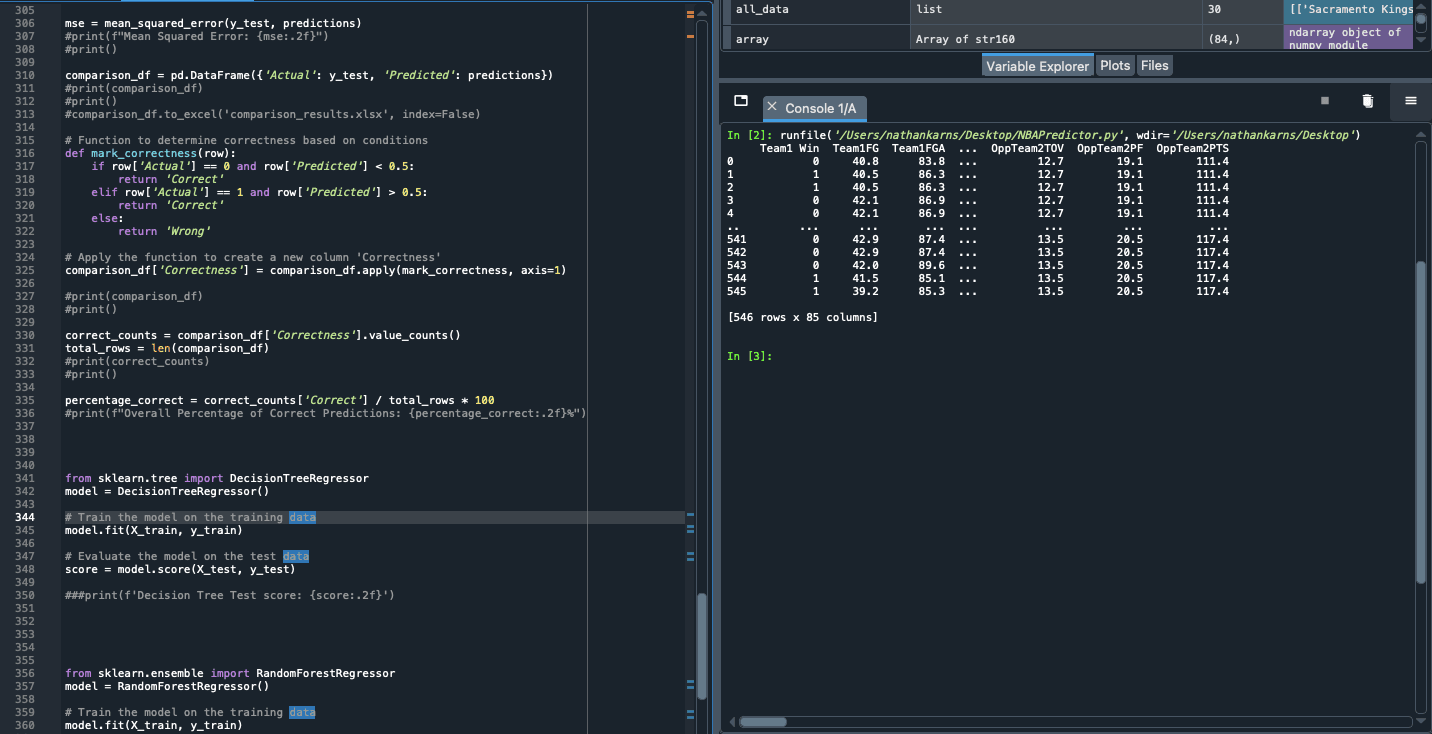
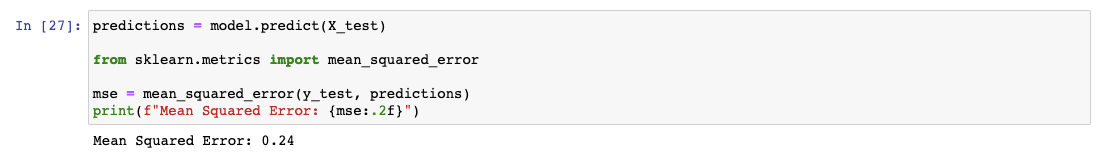
Next, I wanted to find the mean sqaured error for this model in order to see how accurate it is. The lower the score the better, so 0.24 is going to be acceptable for this project.
Next, I wanted to actually look at the games it predicted and see how many it got correct. I will create a quick comparison df for this.
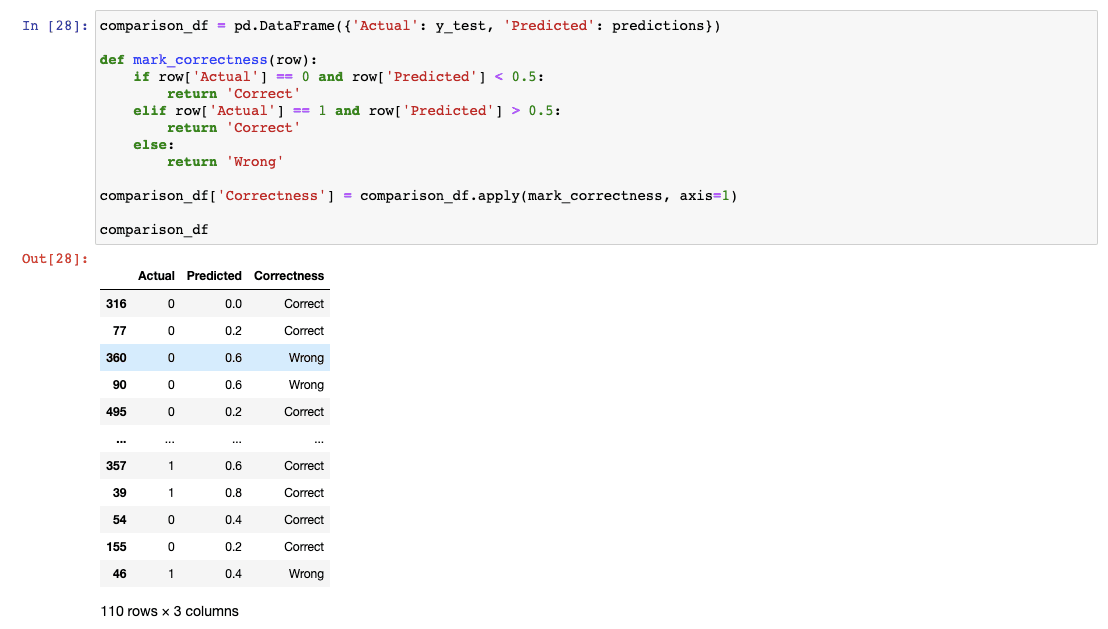
This is kind of hard to see, so I will run an analysis on this df and come up with an overall % correct. Here is how I did that:
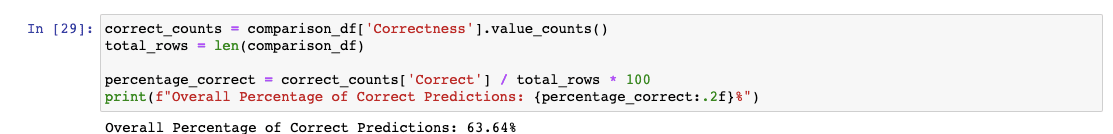
This shows us that the model has greater than a 63% success rate! This is honestly really good in my opinion because this is the first model I have ever created. I expect that this model will be even more accurate once I include data from the remainder of the season, after december.
All in all, I think this project was a success.
Technologies
Python
Pandas
Seaborn
matplotlib.pyplot